Every real-time pipeline that aggregates by event time eventually meets an event that shows up after its window has been reported. A phone reconnects after a flight and uploads an hour of activity. A field gateway buffers telemetry during a network outage. A producer retries with backoff. If the pipeline isn’t designed for it, those events either distort results silently or vanish.
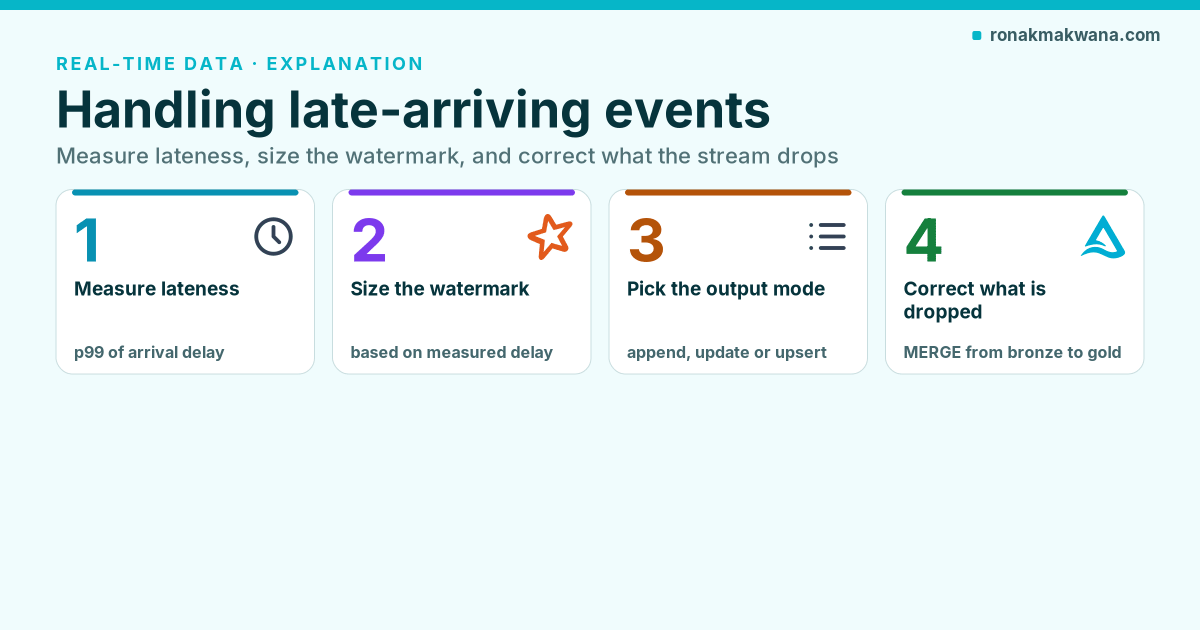
This article explains where late events come from, how streaming engines decide what counts as “too late”, and a set of practical strategies: measuring lateness, sizing watermarks, choosing output modes, and adding a correction path so late data is repaired rather than lost. The examples use Spark Structured Streaming with Delta Lake (run locally) and Azure Stream Analytics settings. For the Structured Streaming basics, start with Apache Spark Structured Streaming: A Practical Guide.
Event time, arrival time and lateness
Every event has at least two timestamps:
- Event time: when it happened at the source, carried in the payload.
- Arrival time: when the broker accepted it. In Event Hubs this is the enqueued time; the Kafka connector exposes it as the
timestampcolumn.
Lateness is arrival time minus event time. It’s rarely constant. Most events arrive within seconds, while a long tail arrives much later because of offline devices, retries or upstream batch exports. Clock skew between devices adds noise in both directions, including events that appear to come from the future.
How the engine decides what is late
Spark uses a watermark: the maximum event time seen so far minus a delay you choose with withWatermark(). Windows that end before the watermark are finalised; in append mode they’re written once and their state is dropped. Events older than the watermark may be ignored.
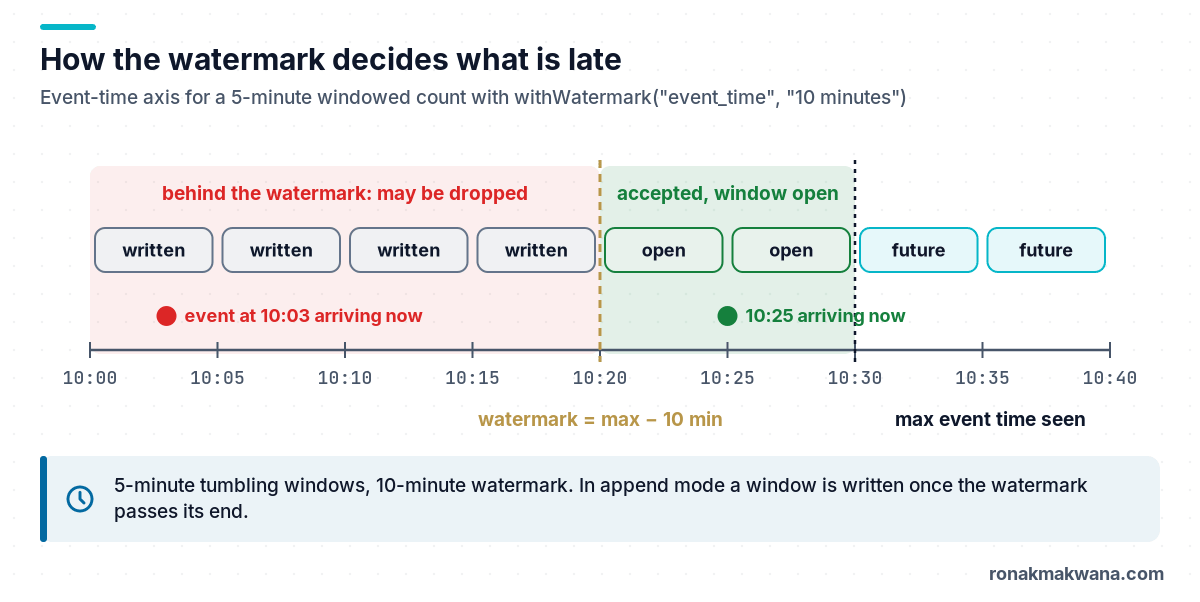
Two details are easy to miss. The guarantee is one-directional: Spark documents that data within the delay is never dropped, and data beyond it may or may not be aggregated. And with several input streams, Spark computes a watermark per stream and by default uses the minimum as the global watermark (spark.sql.streaming.multipleWatermarkPolicy=min), so the slowest stream holds everything back rather than causing data loss. Setting it to max lowers latency but drops data from the slower streams, which Databricks advises using with caution.
Azure Stream Analytics works differently. You configure two job-level policies: an out-of-order tolerance (default 0 seconds) and a late arrival tolerance (default 5 seconds, maximum 20 days). For events outside them you choose either Drop or Adjust, where Adjust rewrites the event’s timestamp to the edge of the tolerance window so it’s counted in a later window. Microsoft notes the 5-second default is likely too small for IoT devices and suggests starting with 5 minutes. With TIMESTAMP BY ... OVER <key>, each key (for example each device) becomes a substream with its own watermark, which helps when device clocks disagree.
Strategy 1: Measure lateness before choosing a delay
Don’t guess the watermark. Keep a bronze table with both timestamps and look at the distribution. This query ran locally on Spark 4.0.4 against a small synthetic clickstream in which one event arrived 38 minutes late:
from pyspark.sql.functions import col, expr, percentile_approx, unix_timestamp

bronze = spark.read.format("delta").load(f"{BASE}/bronze_clicks")

lateness = bronze.withColumn(
    "lateness_s", unix_timestamp("enqueued_time") - unix_timestamp("event_time"))

lateness.agg(
    percentile_approx("lateness_s", 0.5).alias("p50_s"),
    percentile_approx("lateness_s", 0.99).alias("p99_s"),
    expr("max(lateness_s)").alias("max_s"),
    expr("count_if(lateness_s > 600)").alias("later_than_10_min"),
).show()
+-----+-----+-----+-----------------+
|p50_s|p99_s|max_s|later_than_10_min|
+-----+-----+-----+-----------------+
|   20| 2280| 2280|                1|
+-----+-----+-----+-----------------+
On real data, run this over at least a few weeks, broken down by source type or device firmware. The shape of the tail tells you whether one watermark fits everything or whether some sources need a separate path.
Strategy 2: Size the watermark from the business tolerance
The watermark is a trade-off between completeness on one side and latency and state size on the other. A longer delay counts more late events but keeps more windows in memory and, in append mode, delays every result by at least that delay. Databricks’ production guidance suggests starting from a small multiple of your latency SLA and making sure the watermark covers the late data you must not drop.
A practical way to decide:
- Ask the business how late a result can be and still be useful (for example, “a 5-minute dashboard can be up to 15 minutes behind”).
- Check what percentile of lateness that covers using the query above.
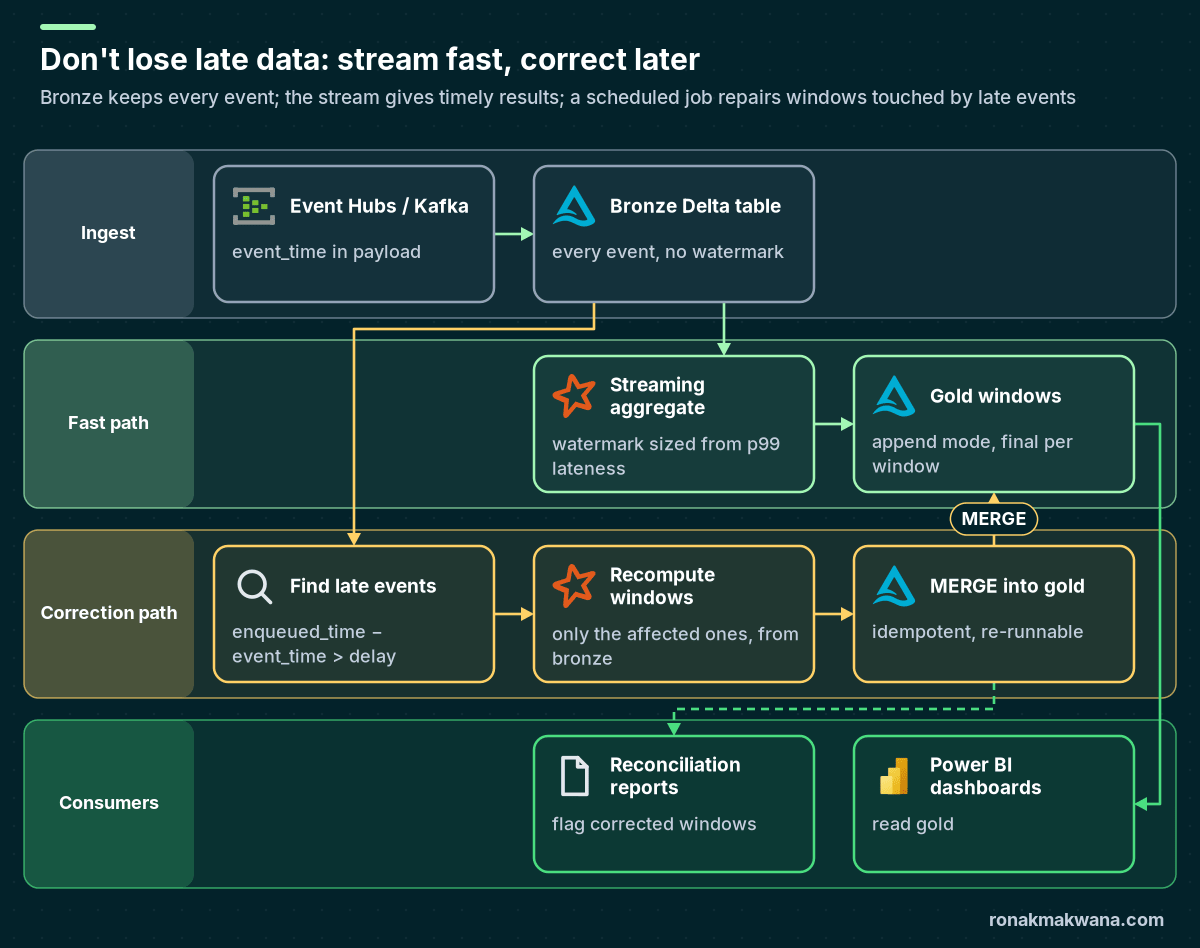
- Route everything beyond it to the correction path in strategy 4, rather than stretching the watermark to cover the extreme tail.
Strategy 3: Use update mode where the sink can take upserts
In append mode, a window is written once, after the watermark passes it. In update mode, Spark writes a window as soon as it has data and rewrites it whenever late (but within-watermark) events change it. That gives early, improving results at the cost of an upsert-capable sink. With Delta, use foreachBatch and MERGE on the window and key:
from delta.tables import DeltaTable
from pyspark.sql.functions import window, count, sum as sum_

agg = (clicks
    .withWatermark("event_time", "15 minutes")
    .groupBy(window("event_time", "5 minutes"), "page")
    .agg(count("*").alias("views"), sum_("duration_s").alias("total_duration_s")))

def upsert_windows(batch_df, batch_id):
    (DeltaTable.forName(spark, "web.gold.page_views_5m").alias("t")
        .merge(batch_df.alias("s"), "t.window = s.window AND t.page = s.page")
        .whenMatchedUpdateAll()
        .whenNotMatchedInsertAll()
        .execute())

(agg.writeStream
    .outputMode("update")
    .foreachBatch(upsert_windows)
    .option("checkpointLocation", "/Volumes/web/ops/checkpoints/page_views_5m")
    .start())
Because the aggregate values are recomputed from state rather than incremented, replaying a batch overwrites a row with the same values, so the MERGE stays idempotent.
Strategy 4: Keep everything in bronze and correct later
The watermark protects state, not data. The reliable way to never lose a late event is to write every raw event to a bronze table with no watermark (a stateless append), and treat the streaming aggregate as the fast but possibly incomplete answer. A scheduled job then finds windows touched by events later than the watermark, recomputes them from bronze and merges the corrected values into gold.
from delta.tables import DeltaTable
from pyspark.sql.functions import col, window, count, sum as sum_, unix_timestamp

WATERMARK_S = 600   # must match the streaming query's delay

b = spark.read.format("delta").load(f"{BASE}/bronze_clicks")
lateness = b.withColumn(
    "lateness_s", unix_timestamp("enqueued_time") - unix_timestamp("event_time"))

late_windows = (lateness.where(col("lateness_s") > WATERMARK_S)
    .select(window("event_time", "5 minutes").alias("window"), "page")
    .distinct())

recomputed = (b.select(window("event_time", "5 minutes").alias("window"), "page", "duration_s")
    .join(late_windows, ["window", "page"])
    .groupBy("window", "page")
    .agg(count("*").alias("views"), sum_("duration_s").alias("total_duration_s")))

(DeltaTable.forPath(spark, f"{BASE}/page_views_5m").alias("t")
    .merge(recomputed.alias("s"), "t.window = s.window AND t.page = s.page")
    .whenMatchedUpdate(set={"views": "s.views", "total_duration_s": "s.total_duration_s"})
    .whenNotMatchedInsertAll()
    .execute())
In my local run, the streaming query had dropped the late 10:03 event (its progress report showed numRowsDroppedByWatermark of 1), so the 10:00–10:05 /home window showed 1 view. After the correction job it showed the complete value:
+-----+-----+--------+-----+----------------+
|start|  end|    page|views|total_duration_s|
+-----+-----+--------+-----+----------------+
|10:00|10:05|   /home|    2|            12.0|
|10:00|10:05|/pricing|    2|            10.0|
|10:05|10:10|   /home|    1|             5.0|
|10:05|10:10|/pricing|    1|             5.0|
+-----+-----+--------+-----+----------------+
In production, limit the scan to recently ingested bronze data (filter on an ingestion date partition or use the Delta change data feed), run the job on a schedule that matches how stale corrected numbers may be, and add a corrected_at column so downstream reports can show which windows changed.
Strategy 5: Deduplicate with the same watermark logic
Late events and duplicates often travel together, because the retries that cause lateness also cause redelivery. dropDuplicatesWithinWatermark(["event_id"]) removes duplicates whose timestamps fall within the watermark. Set the delay above the largest gap you expect between copies of the same event, or duplicates outside it can slip through. Downstream MERGEs keyed on a business ID give you a second line of defence.
Strategy 6: Make lateness visible
- Alert on
numRowsDroppedByWatermarkin Spark’s state operator progress. A rising count means the watermark no longer matches reality. - In Stream Analytics, monitor the Late Input Events, Out-of-Order Events and Watermark Delay metrics.
- Track lateness percentiles per source as a data quality metric, not just a pipeline metric. A firmware change that breaks a device clock shows up here first.
Common mistakes
- Aggregating by processing time because event time “is messy”. The numbers look fine until a consumer restarts and replays an hour of data into one window.
- Setting a watermark of several days to avoid losing anything, then running out of memory as state grows.
- Assuming data beyond the watermark is reliably dropped. It might still be counted, so don’t build logic that depends on it being excluded.
- Leaving Stream Analytics on its 5-second late arrival default for device data.
- Not keeping raw events, which makes later correction impossible.
About this article
The lateness measurement and the correction job were run locally on Apache Spark 4.0.4 with Delta Lake 4.0.1 using synthetic click events, and the outputs shown are from those runs. The update-mode foreachBatch snippet and the Unity Catalog table and volume names are illustrative and weren’t run. Stream Analytics defaults and behaviour come from Microsoft Learn and weren’t tested in a live job.
Last checked against official documentation: October 2026.
Sources
- Handling late data and watermarking (Apache Spark)
- Apply watermarks to control data processing thresholds (Azure Databricks)
- Production considerations for Structured Streaming (Azure Databricks)
- Monitoring Structured Streaming queries (Azure Databricks)
- Time handling in Azure Stream Analytics (Microsoft Learn)
- Table deletes, updates and merges (Delta Lake documentation)
- Event Hubs features and terminology (Microsoft Learn)