“Real-time” means different things to different stakeholders. For a fraud team it means a decision before a payment is authorised. For an operations dashboard it means numbers that are a few seconds old. For finance it often just means “more often than the nightly batch”. Before you pick services, pin down which of these you’re building, because the latency target drives almost every other choice.
This article walks through how to design a real-time data processing architecture on Azure: the building blocks, how they fit together, the design decisions that matter most (event time, partitioning, delivery guarantees, state and replay), and a decision guide for choosing the processing engine. It’s the opening post of a series on real-time data; later posts go deeper into Event Hubs, Structured Streaming, late data and monitoring.
Start with the latency and correctness requirements
Write down three numbers for every stream before drawing any boxes:
- End-to-end latency target. Time from the event happening at the source to the result being usable (an alert raised, a row queryable, an API updated). Be explicit about percentiles; “under 5 seconds at p95” is a requirement, “fast” isn’t.
- Lateness tolerance. How late can an event arrive and still be counted? Mobile devices and field equipment buffer data while offline, so events can arrive minutes or hours after they happened.
- Replay window. If a consumer has a bug, how far back do you need to reprocess? That sets your retention and archive design.
Then classify each output. In practice you’ll see three tiers:
| Tier | Typical consumer | Usual Azure pattern |
|---|---|---|
| Sub-second to a few seconds | Fraud checks, device commands, operational alerts | Event Hubs plus a low-latency processor (Stream Analytics, Databricks real-time mode or a tight micro-batch trigger, or Azure Functions), writing to an operational store or message queue |
| Seconds to a minute | Live dashboards, monitoring, near-real-time KPIs | Micro-batch Structured Streaming or Stream Analytics into Delta tables, an Eventhouse or Azure Data Explorer |
| Minutes | Incremental analytics, lakehouse refresh | Scheduled incremental streaming (the availableNow trigger) over Event Hubs or Capture files |
The last tier is worth calling out. Plenty of “real-time” requests are satisfied by an incremental job that runs every few minutes, and that job is cheaper and simpler to operate than an always-on cluster.
The reference architecture
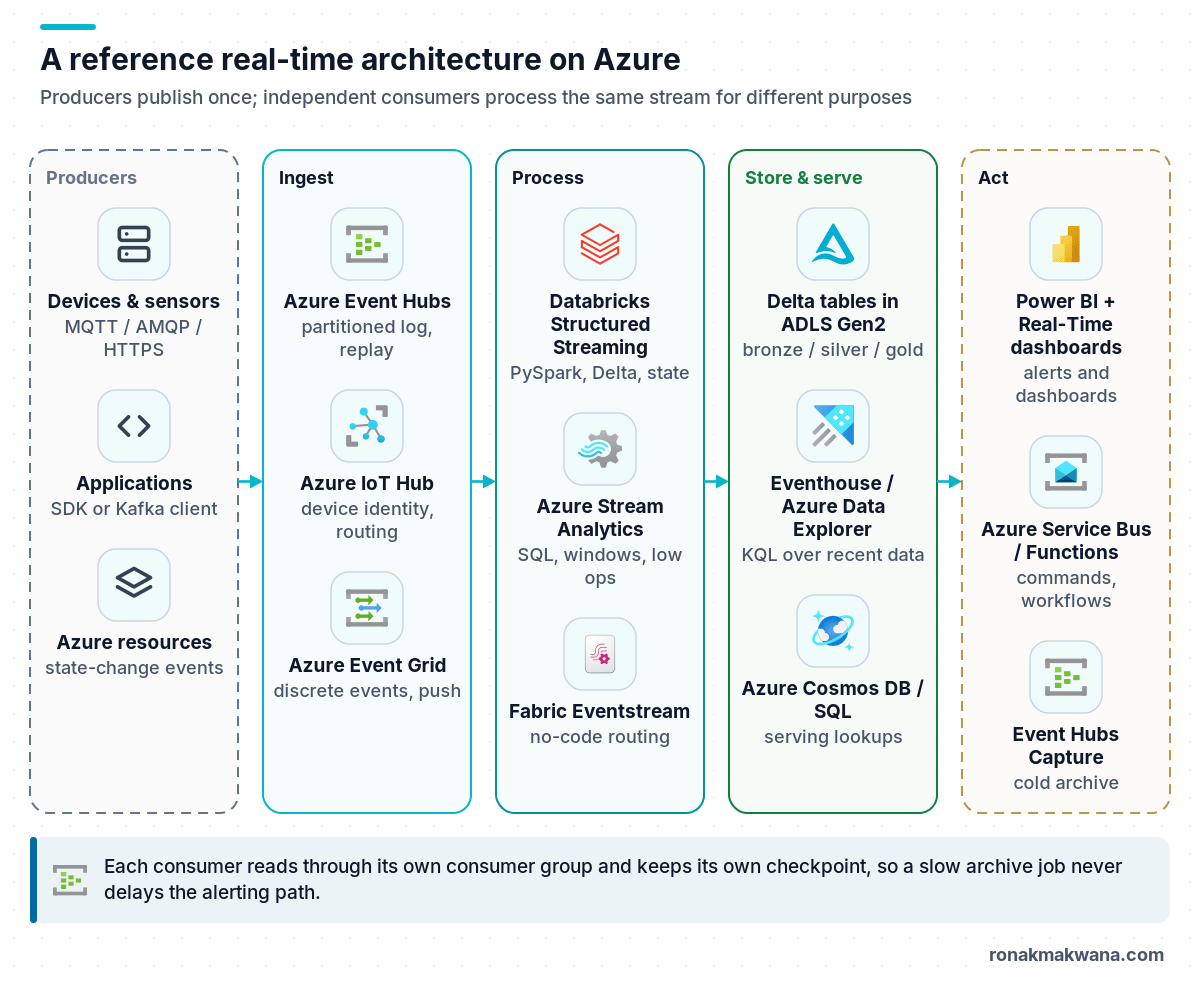
Most Azure real-time platforms share five layers: producers, ingestion, processing, storage and serving, and action.
Ingestion
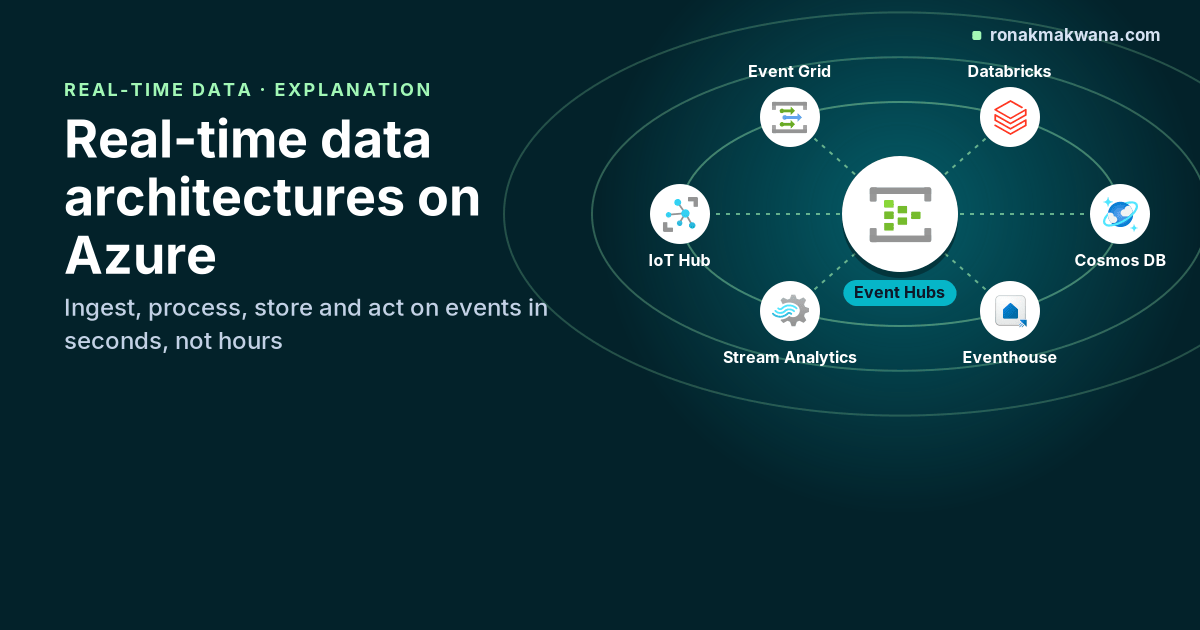
Azure Event Hubs is the default backbone for high-volume streams. Microsoft describes an event hub as an append-only log, equivalent to a Kafka topic, split into partitions that give you ordering per partition and parallelism across them. Consumers pull events and track their own position, so several applications can read the same stream independently through separate consumer groups. Event Hubs also speaks the Apache Kafka protocol, so existing Kafka producers and consumers can connect by changing their bootstrap server configuration.
Azure IoT Hub sits in front when the producers are devices that need per-device identity, cloud-to-device messaging and device management. It routes telemetry onwards, often to Event Hubs or its built-in Event Hubs-compatible endpoint.
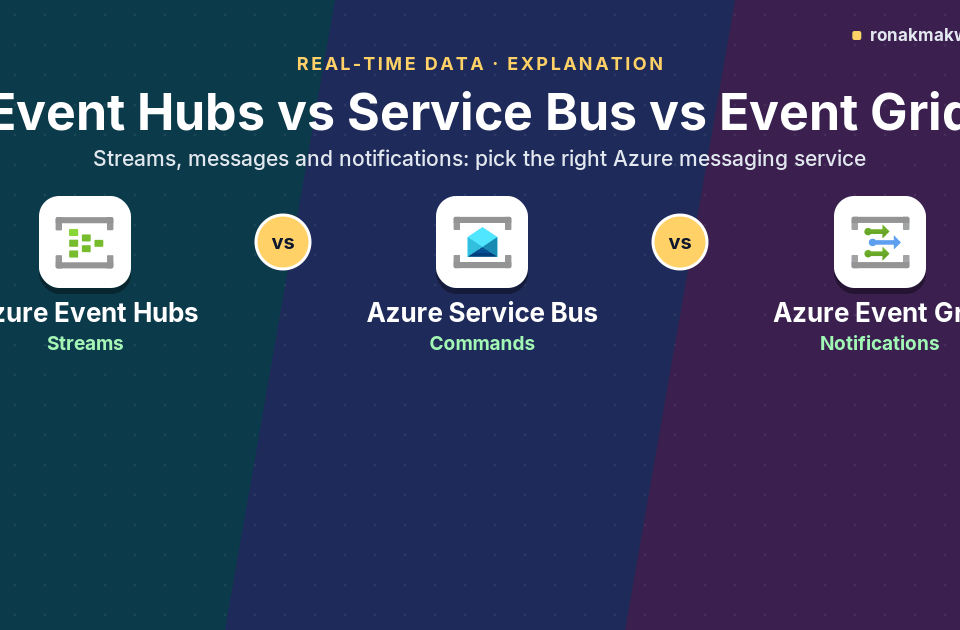
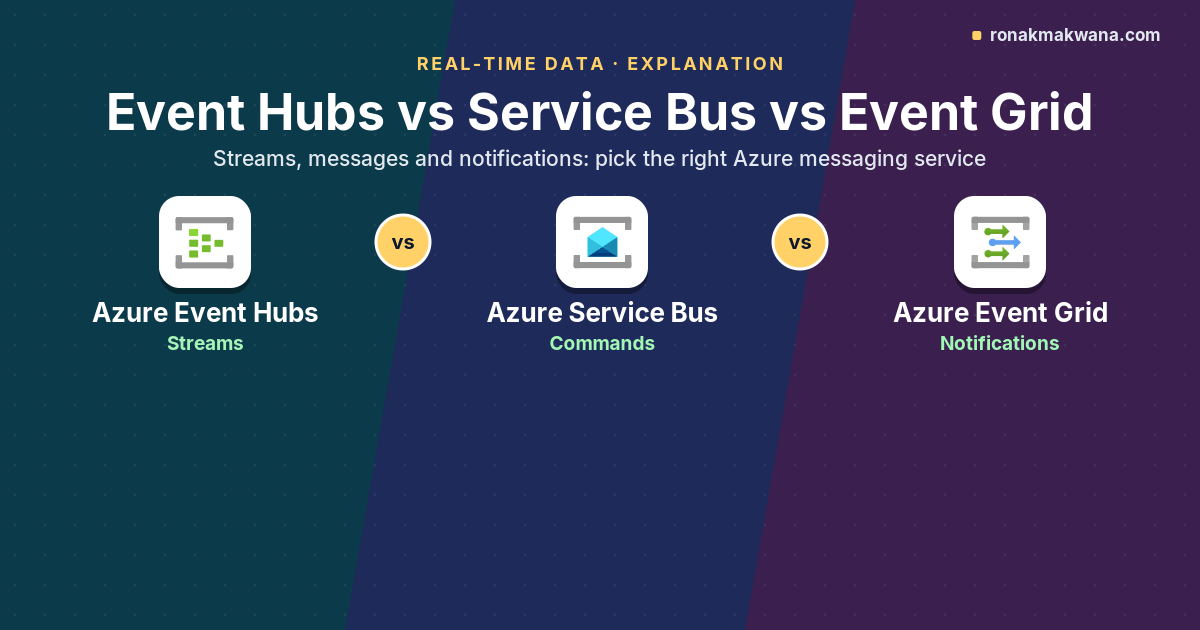
Azure Event Grid is for discrete events (a blob was created, a resource changed) that should be pushed to handlers. It isn’t a replayable log, so don’t use it as the source for analytics that may need reprocessing. The Microsoft comparison of the messaging services summarises it well: Event Grid for reactive event routing, Event Hubs for big data streaming, Service Bus for transactional messaging.
Processing
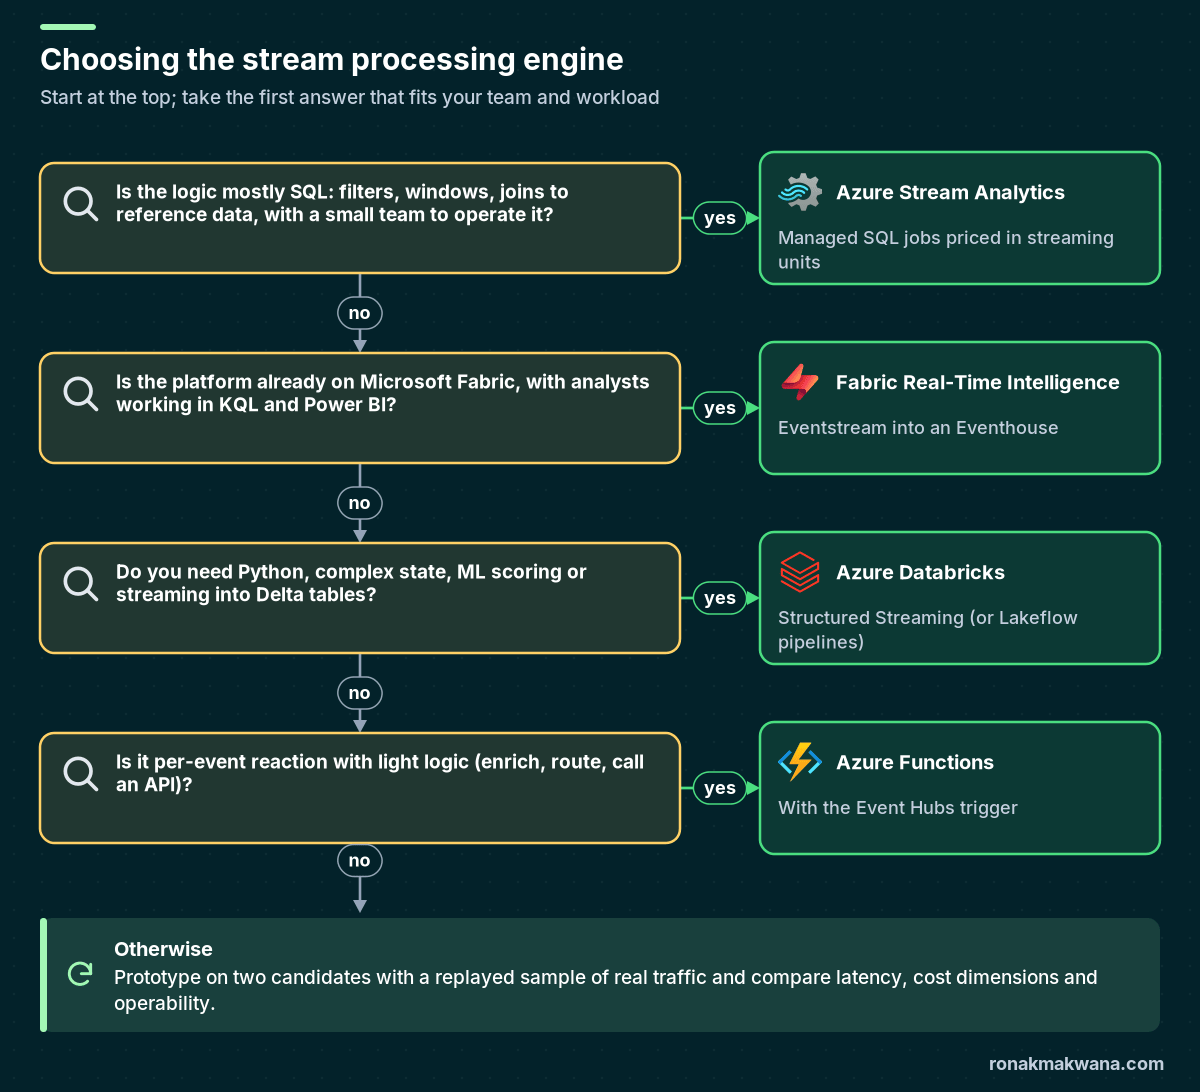
Four processing options cover most needs:
- Azure Stream Analytics: a managed engine with a SQL dialect that adds temporal windows, pattern matching and reference-data joins. You pay for streaming units, with no cluster to manage.
- Azure Databricks Structured Streaming: PySpark or SQL streaming with arbitrary state, ML scoring and native Delta Lake sinks. Databricks recommends Lakeflow pipelines (Spark Declarative Pipelines) for new streaming pipelines, and documents a real-time mode for the lowest-latency operational workloads.
- Microsoft Fabric Real-Time Intelligence: Eventstreams for no-code ingestion and routing, Eventhouses (KQL databases) for fast queries over recent data, and Real-Time dashboards and Activator for reactions. A good fit if your organisation already runs on Fabric.
- Azure Functions with the Event Hubs trigger: per-event or per-batch code for light enrichment, routing and API calls, without windowed state.
Storage, serving and action
Land the processed stream somewhere that matches how it will be read. Delta tables in ADLS Gen2 give you a lakehouse history that batch jobs and BI can share, usually organised as bronze, silver and gold layers. An Eventhouse or Azure Data Explorer cluster serves interactive KQL queries over recent telemetry. Cosmos DB or Azure SQL serve low-latency lookups to applications. Actions (alerts, workflow messages to Service Bus, calls to downstream APIs) hang off the processing layer.
Finally, archive the raw stream. Event Hubs Capture writes events to Blob Storage or ADLS Gen2 in Avro by default (Parquet is available through the no-code editor), which gives you a cold copy for replay beyond the hub’s retention period.
Design decisions that make or break the platform
1. Event time versus processing time
Aggregate on the time the event happened (a field in the payload), not the time it reached Azure. Processing time is easy but produces wrong answers whenever producers buffer, networks stall or a consumer restarts and catches up. Every engine above supports event time: Stream Analytics with TIMESTAMP BY, Spark with withWatermark() on an event-time column.
2. Partitioning and keys
Event Hubs only guarantees order within a partition, and the partition count caps how many consumers in one group can read in parallel. Use a partition key that groups events that must stay ordered (a device ID, an account ID). Choose the partition count up front for Basic and Standard namespaces; Microsoft notes that only Premium and Dedicated let you increase it after creation, and never decrease it.
3. Delivery guarantees and idempotency
Event Hubs, Event Grid and Service Bus all deliver at least once, so duplicates will reach your processors. Design sinks to be idempotent: MERGE on a business key, upsert by event ID, or deduplicate within a watermark. Structured Streaming gives exactly-once semantics into Delta when you use a checkpoint, but foreachBatch writes to external systems are at least once unless you make them idempotent.
4. State, watermarks and lateness
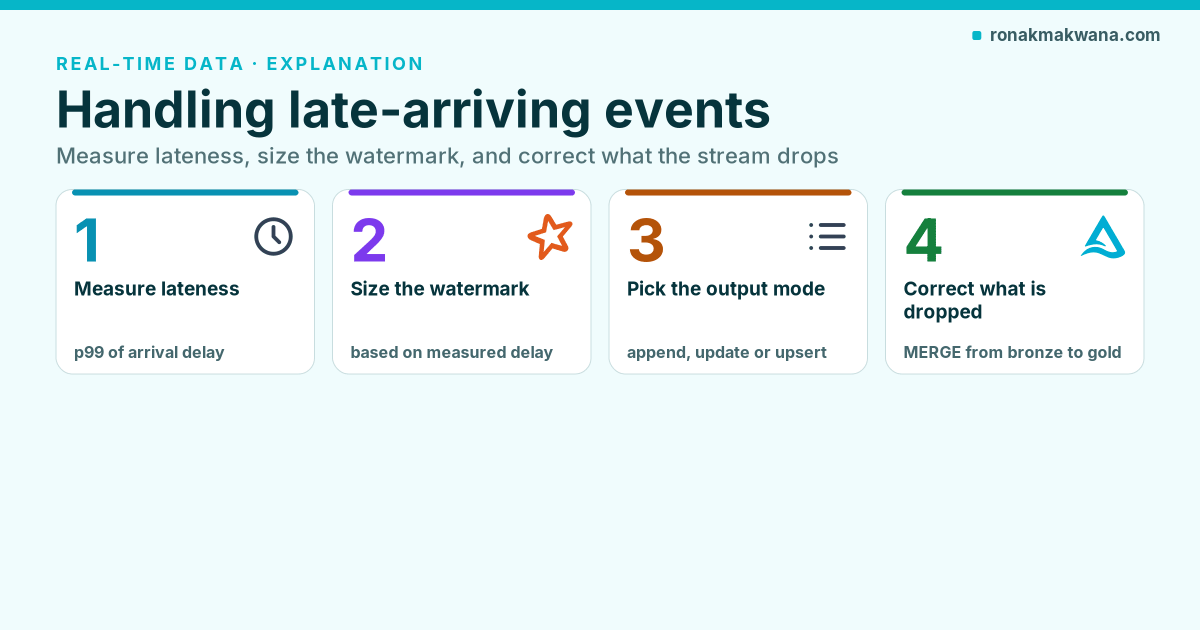
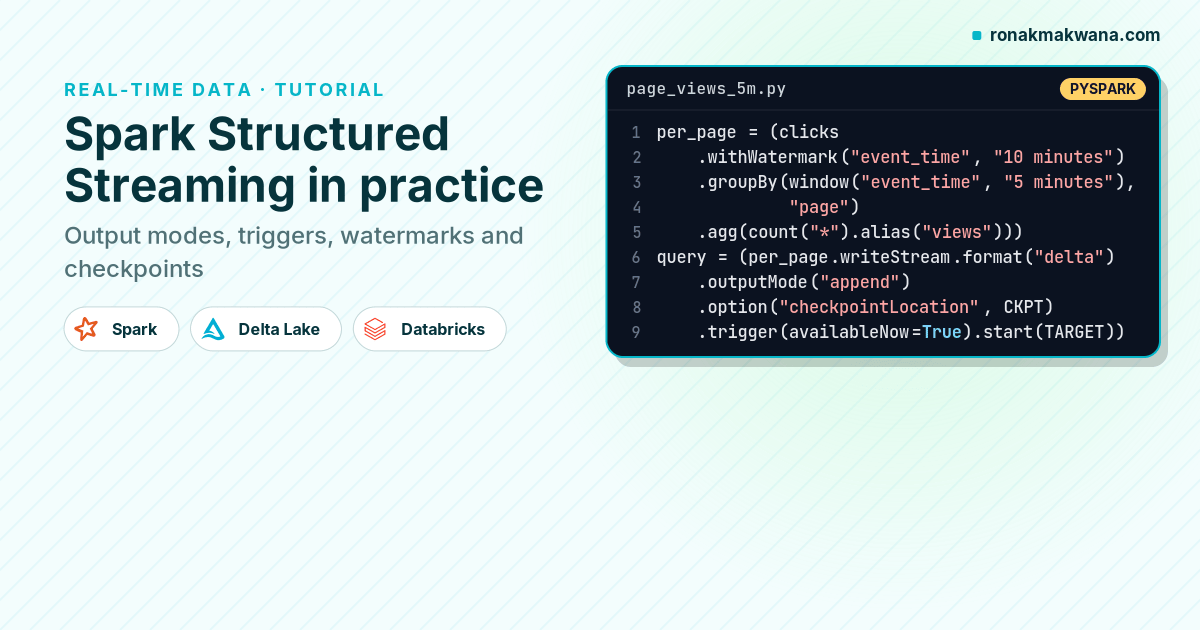
Windows, joins and deduplication keep state. Watermarks bound that state by declaring how late data may be. A longer watermark tolerates more lateness but holds more state and delays append-mode output. Size it from the lateness tolerance you wrote down at the start, not from a default.
5. Replay and schema evolution
Assume you’ll need to reprocess. Keep Event Hubs retention long enough to cover a weekend outage, archive with Capture, and keep one checkpoint per query so you can rebuild a single consumer without touching the others. Version your event schema explicitly; Event Hubs includes a schema registry for schema-driven formats such as Avro, JSON Schema and Protobuf, so producers and consumers can agree on contracts.
Choosing the processing engine
Here’s the same windowed alert expressed in two engines so you can compare the development model.
Stream Analytics, using the event’s own timestamp and a one-minute tumbling window:
SELECT
    DeviceId,
    System.Timestamp() AS WindowEnd,
    AVG(Temperature)   AS AvgTemperature,
    COUNT(*)           AS Readings
INTO [alerts-output]
FROM [telemetry-input] TIMESTAMP BY EventTime
GROUP BY DeviceId, TumblingWindow(minute, 1)
HAVING AVG(Temperature) > 75
Structured Streaming on Azure Databricks, reading Event Hubs through the Kafka connector with a Unity Catalog service credential (supported on Databricks Runtime 16.1 and above) and writing to a Delta table:
from pyspark.sql.functions import from_json, col, window, avg, count

schema = "device_id STRING, event_time TIMESTAMP, temperature DOUBLE"

raw = (spark.readStream.format("kafka")
       .option("kafka.bootstrap.servers", "contoso-telemetry.servicebus.windows.net:9093")
       .option("subscribe", "telemetry")
       .option("databricks.serviceCredential", "eh-telemetry-reader")
       .option("startingOffsets", "latest")
       .option("maxOffsetsPerTrigger", 500000)
       .load())

events = (raw
          .select(from_json(col("value").cast("string"), schema).alias("e"))
          .select("e.*"))

alerts = (events
          .withWatermark("event_time", "10 minutes")
          .groupBy(window("event_time", "1 minute"), "device_id")
          .agg(avg("temperature").alias("avg_temperature"),
               count("*").alias("readings"))
          .where("avg_temperature > 75"))

(alerts.writeStream
       .outputMode("append")
       .option("checkpointLocation", "/Volumes/iot/streaming/checkpoints/temperature_alerts")
       .trigger(processingTime="0 seconds")
       .toTable("iot.silver.temperature_alerts"))
The SQL version is shorter and has nothing to operate. The PySpark version gives you Delta output, unit-testable Python, and room for logic that SQL can’t express. Note the different lateness models: Stream Analytics applies job-level out-of-order and late-arrival policies (the late-arrival default is 5 seconds, which Microsoft calls likely too small for IoT devices), while Spark uses the per-query watermark.
Operating it
Real-time systems fail quietly: the job is “running” but falling behind. Plan monitoring from day one:
- Lag: how far consumers are behind the head of the stream (offset lag for Kafka-protocol consumers, watermark delay in Stream Analytics).
- Throughput: incoming versus processed events per second. A persistent gap means lag will grow.
- Throttling and capacity: throttled requests on the Event Hubs namespace, which signal that throughput or processing units need scaling.
- Restarts: run Databricks streams as Lakeflow Jobs on jobs compute with continuous scheduling so failed runs restart with backoff, as Databricks recommends.
For cost, Event Hubs is billed by capacity units (throughput units, processing units or dedicated capacity units) rather than partition count, Stream Analytics by streaming units, and Databricks by compute. Check the current pricing pages for each and model your sustained and peak event rates against them rather than estimating from list prices.
A design checklist
- Latency target, lateness tolerance and replay window written down per stream.
- Event Hubs tier and partition count chosen for peak load and ordering keys.
- One consumer group per consuming application, one checkpoint per query.
- Event-time processing with watermarks sized from real lateness.
- Idempotent sinks; duplicates expected and handled.
- Raw stream archived (Capture) and schema versioned.
- Lag, throughput and throttling alerts in place before go-live.
About this article
The architecture, Stream Analytics query and PySpark snippet are illustrative. They follow the syntax and options in the Microsoft Learn and Databricks documentation listed below but were not run against a live Azure environment for this article; test them in a non-production subscription first. Service limits and defaults change, so confirm them on the linked pages before you size a production system.
Last checked against official documentation: October 2026.
Sources
- Event Hubs features and terminology (Microsoft Learn)
- Azure Event Hubs quotas and limits (Microsoft Learn)
- Capture streaming events with Event Hubs Capture (Microsoft Learn)
- Compare Azure messaging services (Microsoft Learn)
- Welcome to Azure Stream Analytics (Microsoft Learn)
- Time handling in Azure Stream Analytics (Microsoft Learn)
- Production considerations for Structured Streaming (Azure Databricks)
- Kafka connector authentication, including Event Hubs (Azure Databricks)
- What is Real-Time Intelligence? (Microsoft Fabric)